Increasing Intervals
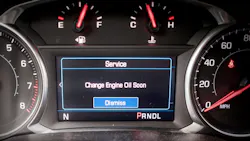
In recent years, extended drain intervals have become a more common pain point for quick lube operators. Just how long are customers waiting to bring their vehicles in for an oil change?
Based on data from the annual NOLN Operator Survey, the average drain interval for passenger vehicles serviced in readers’ shops has increased by 11.6% since 2021. From 2003, the first year in which NOLN asked readers about their customers’ average number of miles between oil changes, the increase is 26.0%.
The following is a breakdown of how drain intervals have increased over the past 24 years.
Average miles between oil changes: The past 5 years
|
2026 |
5,508 |
|
2025 |
5,339 |
|
2024 |
5,329 |
|
2023 |
5,269 |
|
2022 |
5,155 |
Average miles between oil changes: Historical data points
|
2021 |
4,934 |
|
2016 |
4,532 |
|
2011* |
4,895 (LT30) |
|
2006 |
4,268 |
|
2003 |
4,372 |
* For the 2011 NOLN Operator Survey, data was divided between shops serving less than 30 and more than 30 vehicles per day.